| Title Crime Hot Spots in West Sacramento | |||||||||||||||
|
Author Juanita Cano American River College, Geography 350: Data Acquisition in GIS; Spring 2013 | |||||||||||||||
|
Abstract Crime hot spots occurring in West Sacramento in 2012 are examined for possible patterns based on income and location of high density residential. | |||||||||||||||
|
Introduction The West Sacramento Police Department has a crime map website that allows the public to see crimes that have been reported in the city within a few days of their occurrence. When I stumbled across this webpage it raised some curiousity as to the locations and areas that have the most crime. It also raised the question about what type of land use these crime hot spots are near or where they occur. Is there some correlation with the income of the area that these hot spots of crime occur within? Will mapping the location of the selected crimes and looking at the density of the crimes within a certain radius show a pattern of hot spots? Is there a relationship between crime hot spots, high density residential, and income that could reveal a pattern? Does high density residential draw crime to an area and is income also a large part of the influence that crime has on an area? The overall idea is to see if location of these crime hot spots are related. Do underlying social and environmental processes generate crimes in certain areas? | |||||||||||||||
|
Background A widely held belief is that high-density land use is intimately associated with high crime rate. However, results of GIS analysis done by Jianling Li, PH.D. and Jack Rainwater show that high crime rate is not necessarily linked to high-density development, but more to the low socioeconomic status of the delinquents. This paper demonstrates the utility of GIS in the study of the relationship between land use patterns and crime rates and in the development of livable communities. Hot spots are conditions that show some clustering in a special distribution. There is also a qualitative aspect in hot spots that is limited to certain types of crime, for example: (Keith Harries Ph. D., 1999) states that generally, the hot spot concept is applied to street crime rather than white-collar crime, organized crime, or terrorist crime. This may be because white-collar crime does not cause the same kind of community fear and anxiety as street crime. | |||||||||||||||
|
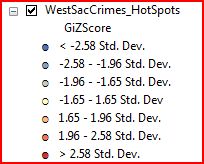
Methods Data Collected I requested a list of the crime data for 2012 from the West Sacramento police department which contained 4,441 records, many of the crimes listed would not be of interest for this study. White-collar crimes were the first to be excluded as well as any vehicular crimes and DUIs. The majority of the traffic offenses had already been excluded from the list based on my request. There were also crimes that could not be mapped because they had no addresses or the location was very general. The process of excluding crimes reduced the number to 620 crimes. The list of crimes that was utilized for this analysis included crimes such as aggravated assault, burglary, larceny theft (except motor vehicle), motor vehicle theft, other assaults, robbery, and finally vandalism. All these crimes are things that are more applicable to the types of problems that are often seen in residential neighborhoods. The next step was to obtain a base map which I found on the City of West Sacramento website. Here I was able to obtain a layer for the parcels, addresses, and land uses. The excel spread sheet for crimes was then joined to the addressing table in order to map the crime location points. Census data was downloaded from the United States Census Bureau TIGER products. I utilized the TIGER/Line Shapefiles which were available and pre-joined with demographic data. These geodatabases join the geography from the TIGER/Line Shapefiles to the 2006-2010 American Community Survey 5-year estimates data profiles.Only the estimated, income & benefites (in 2010 inflation-adjusted dollers-median family income) was used for this study. Data Processing In order to create hot spots I utilized the Hot Spot Analysis (Getis-Ord Gi*) (Spatial Statistics) tool. This tool identifies statistically significant spatial clusters of high values (hot spots) and low values (cold spots). It creates a new Output Feature Class with a z-score and p-value for each feature in the Input Feature Class. This did not work the way I had anticipated, see below: | |||||||||||||||
| 
I was unable to figure out the problem and tried a different approach which gave me something similar to what the hot spot analysis would of
created but without the weighted mean center. I used the Point Density (Spatial Analyst) tool. I gave it a radius of .25 miles since that is
generally what people consider their neighborhood “territory”. Then I assigned a color to it in order to distinguish where the hot spots were
located. | As underlying information I added the median family income by tracts which was derived from the census data. I also included the high density residential locations by selecting this land use and exporting it as a layer.
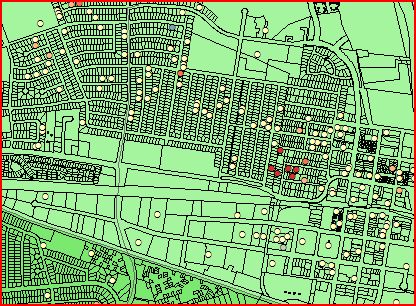
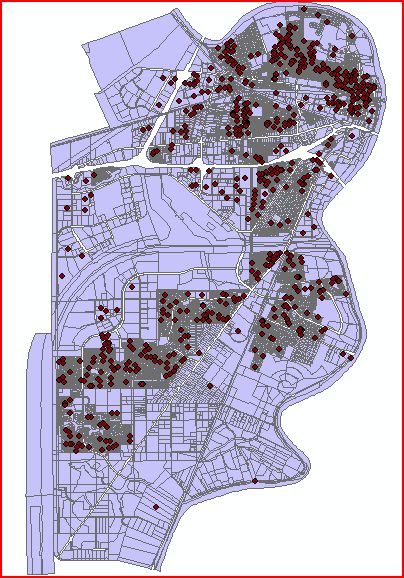
| Results The locations of the crimes were mapped on the parcel layer in order to get a visual of the locations.
 The map was then symbolized with the median family income, high density residential locations, and crime locations. 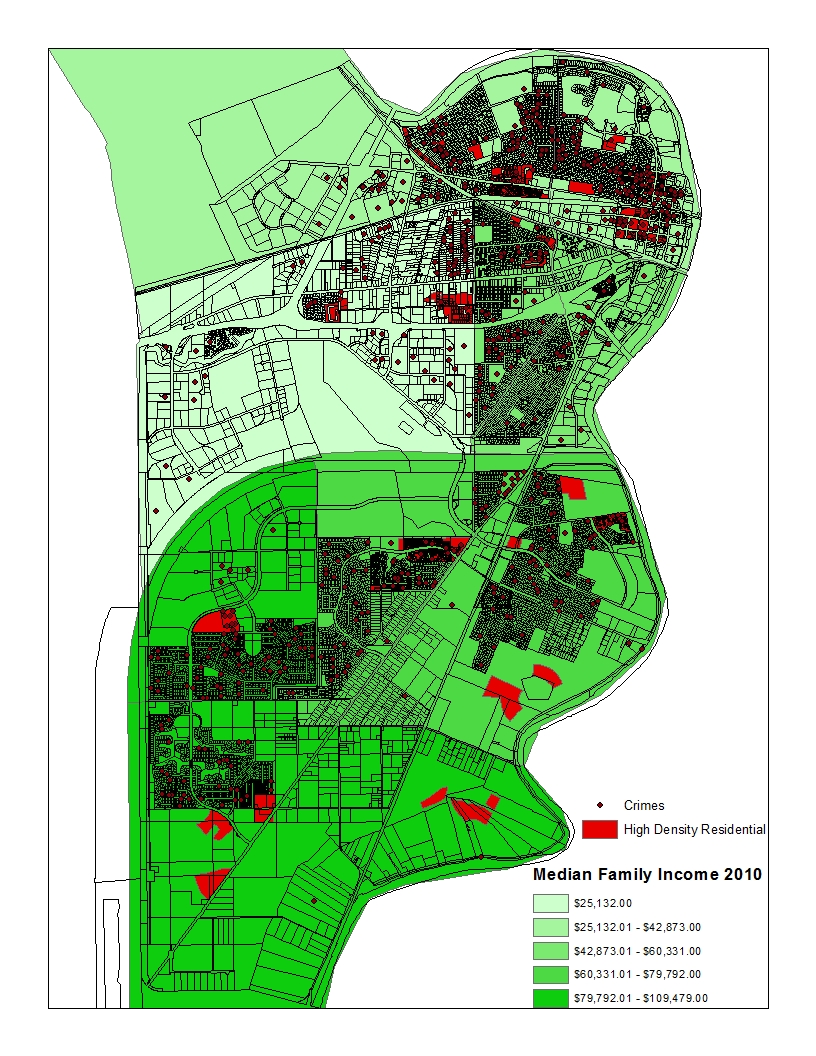
Hotspot analysis
of the crime location indicates where the clusters in the data exist. | 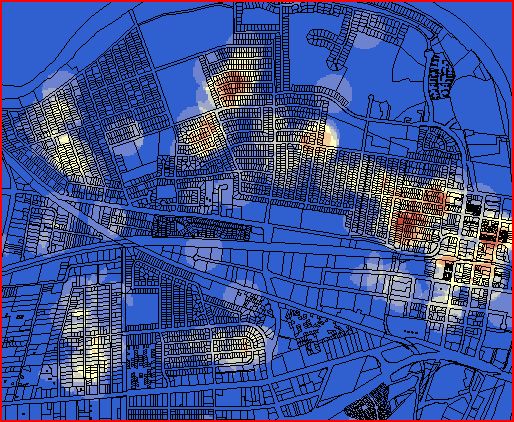 This area was the one that showed the most concentration of hot spots. 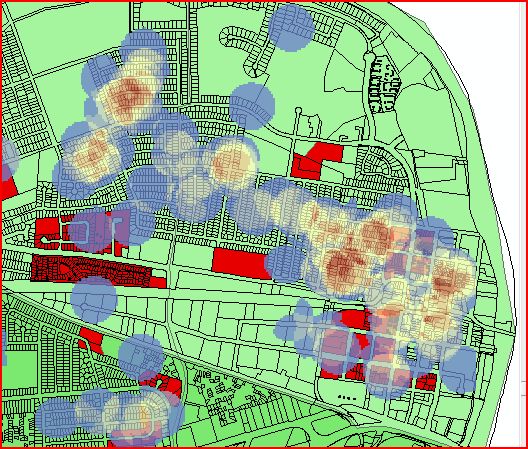 I removed the first color of blue which indicated that those area were cold spots. These served no purpose for this study,
since the focus was directed to hot spots. These hot spots were created with the overlapping areas for the points, which were given a .25 mile radius. 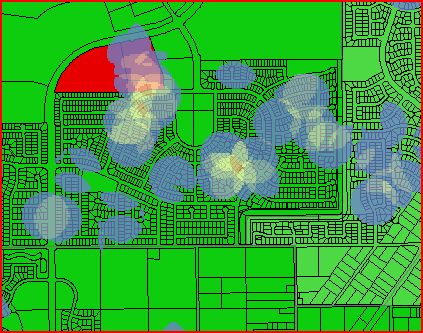 The area that had higher income only had a few hot spots, but the majority were within the residential area. One hot spot was very close
to the high density residential area but it's hard to determine if there is a corralation.
| Analysis The analysis of the relation of crimes to land use quickly revealed that there was not a concrete pattern
between the two. The spatial phenomena of the crime hot spots were harder to produce. Taking a statistical approach to determine the number of clusters or creating hot spots with the
appropriate tool may have provide more significant data with values. The median household income used in the study was problematic. It’s hard
to determine what measure of income to use. The census contains data on family income and household income. Families are subsets of households,
so data for families exclude single persons living alone or unrelated persons living together (who constitute households). Family income will be
higher than household income because the average family has more wage earners than the average household. The results of this study were determined
by taking on more of a visual approach then a statistical approach. Possibly looking at other social conditions such as non-homeowner occupied
homes, or unemployment level can help provide more answers.
| Conclusions The goal of the analysis had been to identify hot spots of crime, to see if there were more crimes
in areas that had high density residential and also to see if there was some correlation to the median income of the area. I’m not sure if I was
completely successful in this analysis due to the fact that the median income was derived for tracts rather than block groups. There is an area to
the north of the area of high crime that is a gated neighborhood with large expensive homes. In making an assumption I would guess that the median
income would have to be somewhat high. If that income is added to the income of the area of high crime then the average or range could make it seem
as though the income in this area is not extremely low “poverty level”, but closer to middle class income levels. Also when comparing where the
high density residential areas were in relation to the areas of high crime or hot spots, it did not completely appear that these areas were magnets
for high crime. In fact most crimes occurred within the single family residential areas. This type of information could be valuable to police
officers and neighborhood watch groups. Knowing where crime is concentrated helps law enforcement agencies make better decisions about allocating
police resources, such as increasing patrolling and implementing crime prevention programs. In addition, mapping crime hot spots can effectively
communicate crime patterns and crime prevention strategies to decision makers and the public.
| References "City of West Sacramento - GIS." City of West Sacramento - Downloads. Harries, Keith, PhD, 1999. Mapping Crime: Principle and Practice. Jianling Li, Ph.D. and Jack Rainwater. “The Real Picture of Land-Use Density and Crime: A GIS Application", .n.d. "United States Census Bureau ." (TIGER) 2006-2010 American Community Survey 5-year Estimates Data Profiles.
| | |||||||